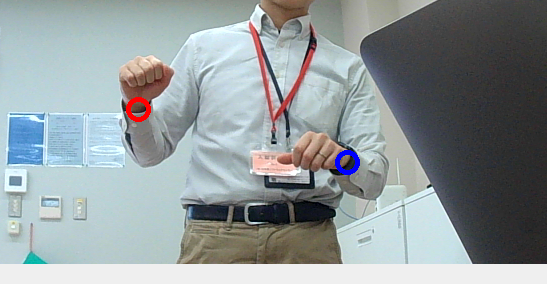
YOLOポーズ推定の結果利用
2024-02-08 日本語 raspi opencv yolo
前回はplotメソッドに頼って勝手に色分け&接続されたキーポイントを表示していましたが、今回は自分で描いています。ultralyticsのドキュメント上では定義を見つけきれなかったのですが、COCOというデータセットの定義と一致しているようです。左手と右手の位置に円を描くサンプルです。
import cv2

if __name__ == '__main__':
    cv2.namedWindow('find-on-video')
    cam = cv2.VideoCapture(0)

    from ultralytics import YOLO
    model = YOLO('yolov8n-pose.pt')
    while True:
        ret, image = cam.read()
        results = model(image)
        #cv2.imshow('find-on-video',results[0].plot())
        if len(results[0].keypoints.xy[0]) == 17:
            l = results[0].keypoints.xy[0][9] # left wrist
            r = results[0].keypoints.xy[0][10] # right wrist
            cv2.circle(image,(int(l[0]),int(l[1])),10,(255,0,0),3) # blue
            cv2.circle(image,(int(r[0]),int(r[1])),10,(0,0,255),3) # red
        cv2.imshow('find-on-video',image)
        k = cv2.waitKey(1)
        if k != -1:
            break

    cam.release()
    cv2.destroyAllWindows()