RaspberryPiでTensorflow
2023-12-15 python raspi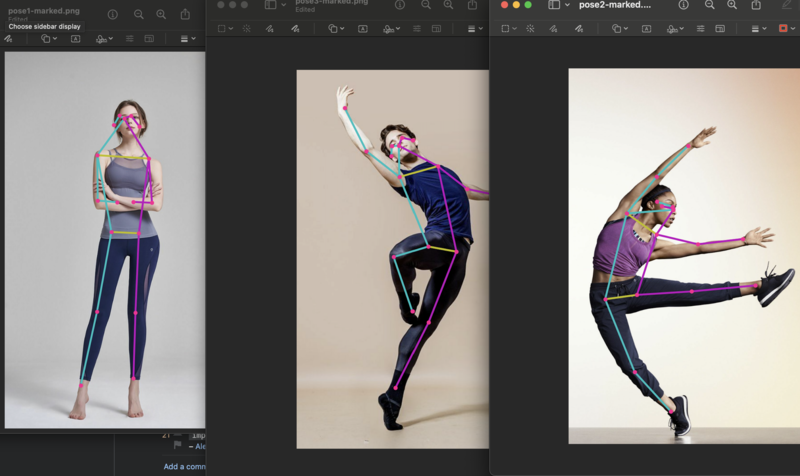
RaspberryPiでは、aptコマンドでPythonライブラリを追加することが多いのですが、tensorflowはパッケージとして提供されていないようなので、以下の手順が必要でした。
sudo apt install python3-full
python3 -m venv ./venv
./venv/bin/pip3 install tensorflow tensorflow_hub opencv-python imageio matplotlib
試しに使ったプログラムはこちら。Tensorflowのチュートリアルを切り貼りしたものです。
import tensorflow as tf
import tensorflow_hub as hub
import numpy as np
import cv2
from matplotlib import pyplot as plt
from matplotlib.collections import LineCollection
import matplotlib.patches as patches
import imageio

# Dictionary that maps from joint names to keypoint indices.
KEYPOINT_DICT = {
    'nose': 0,
    'left_eye': 1,
    'right_eye': 2,
    'left_ear': 3,
    'right_ear': 4,
    'left_shoulder': 5,
    'right_shoulder': 6,
    'left_elbow': 7,
    'right_elbow': 8,
    'left_wrist': 9,
    'right_wrist': 10,
    'left_hip': 11,
    'right_hip': 12,
    'left_knee': 13,
    'right_knee': 14,
    'left_ankle': 15,
    'right_ankle': 16
}

# Maps bones to a matplotlib color name.
KEYPOINT_EDGE_INDS_TO_COLOR = {
    (0, 1): 'm',
    (0, 2): 'c',
    (1, 3): 'm',
    (2, 4): 'c',
    (0, 5): 'm',
    (0, 6): 'c',
    (5, 7): 'm',
    (7, 9): 'm',
    (6, 8): 'c',
    (8, 10): 'c',
    (5, 6): 'y',
    (5, 11): 'm',
    (6, 12): 'c',
    (11, 12): 'y',
    (11, 13): 'm',
    (13, 15): 'm',
    (12, 14): 'c',
    (14, 16): 'c'
}

def _keypoints_and_edges_for_display(keypoints_with_scores,
                                     height,
                                     width,
                                     keypoint_threshold=0.11):
    """Returns high confidence keypoints and edges for visualization.

    Args:
        keypoints_with_scores: A numpy array with shape [1, 1, 17, 3] representing
        the keypoint coordinates and scores returned from the MoveNet model.
        height: height of the image in pixels.
        width: width of the image in pixels.
        keypoint_threshold: minimum confidence score for a keypoint to be
        visualized.

    Returns:
        A (keypoints_xy, edges_xy, edge_colors) containing:
        * the coordinates of all keypoints of all detected entities;
        * the coordinates of all skeleton edges of all detected entities;
        * the colors in which the edges should be plotted.
    """
    keypoints_all = []
    keypoint_edges_all = []
    edge_colors = []
    num_instances, _, _, _ = keypoints_with_scores.shape
    for idx in range(num_instances):
        kpts_x = keypoints_with_scores[0, idx, :, 1]
        kpts_y = keypoints_with_scores[0, idx, :, 0]
        kpts_scores = keypoints_with_scores[0, idx, :, 2]
        kpts_absolute_xy = np.stack(
            [width * np.array(kpts_x), height * np.array(kpts_y)], axis=-1)
        kpts_above_thresh_absolute = kpts_absolute_xy[
            kpts_scores > keypoint_threshold, :]
        keypoints_all.append(kpts_above_thresh_absolute)

        for edge_pair, color in KEYPOINT_EDGE_INDS_TO_COLOR.items():
            if (kpts_scores[edge_pair[0]] > keypoint_threshold and
                kpts_scores[edge_pair[1]] > keypoint_threshold):
                x_start = kpts_absolute_xy[edge_pair[0], 0]
                y_start = kpts_absolute_xy[edge_pair[0], 1]
                x_end = kpts_absolute_xy[edge_pair[1], 0]
                y_end = kpts_absolute_xy[edge_pair[1], 1]
                line_seg = np.array([[x_start, y_start], [x_end, y_end]])
                keypoint_edges_all.append(line_seg)
                edge_colors.append(color)
        if keypoints_all:
            keypoints_xy = np.concatenate(keypoints_all, axis=0)
        else:
            keypoints_xy = np.zeros((0, 17, 2))

        if keypoint_edges_all:
            edges_xy = np.stack(keypoint_edges_all, axis=0)
        else:
            edges_xy = np.zeros((0, 2, 2))
    return keypoints_xy, edges_xy, edge_colors


def draw_prediction_on_image(
    image, keypoints_with_scores, crop_region=None, close_figure=False,
    output_image_height=None):
    """Draws the keypoint predictions on image.

    Args:
        image: A numpy array with shape [height, width, channel] representing the
        pixel values of the input image.
        keypoints_with_scores: A numpy array with shape [1, 1, 17, 3] representing
        the keypoint coordinates and scores returned from the MoveNet model.
        crop_region: A dictionary that defines the coordinates of the bounding box
        of the crop region in normalized coordinates (see the init_crop_region
        function below for more detail). If provided, this function will also
        draw the bounding box on the image.
        output_image_height: An integer indicating the height of the output image.
        Note that the image aspect ratio will be the same as the input image.

    Returns:
        A numpy array with shape [out_height, out_width, channel] representing the
        image overlaid with keypoint predictions.
    """
    height, width, channel = image.shape
    aspect_ratio = float(width) / height
    fig, ax = plt.subplots(figsize=(12 * aspect_ratio, 12))
    # To remove the huge white borders
    fig.tight_layout(pad=0)
    ax.margins(0)
    ax.set_yticklabels([])
    ax.set_xticklabels([])
    plt.axis('off')

    im = ax.imshow(image)
    line_segments = LineCollection([], linewidths=(4), linestyle='solid')
    ax.add_collection(line_segments)
    # Turn off tick labels
    scat = ax.scatter([], [], s=60, color='#FF1493', zorder=3)

    (keypoint_locs, keypoint_edges,
    edge_colors) = _keypoints_and_edges_for_display(
        keypoints_with_scores, height, width)

    line_segments.set_segments(keypoint_edges)
    line_segments.set_color(edge_colors)
    if keypoint_edges.shape[0]:
        line_segments.set_segments(keypoint_edges)
        line_segments.set_color(edge_colors)
    if keypoint_locs.shape[0]:
        scat.set_offsets(keypoint_locs)

    if crop_region is not None:
        xmin = max(crop_region['x_min'] * width, 0.0)
        ymin = max(crop_region['y_min'] * height, 0.0)
        rec_width = min(crop_region['x_max'], 0.99) * width - xmin
        rec_height = min(crop_region['y_max'], 0.99) * height - ymin
        rect = patches.Rectangle(
            (xmin,ymin),rec_width,rec_height,
            linewidth=1,edgecolor='b',facecolor='none')
        ax.add_patch(rect)

    fig.canvas.draw()
    image_from_plot = np.frombuffer(fig.canvas.buffer_rgba(), dtype=np.uint8)
    image_from_plot = image_from_plot.reshape(
        fig.canvas.get_width_height()[::-1] + (4,))
    plt.close(fig)
    if output_image_height is not None:
        output_image_width = int(output_image_height / height * width)
        image_from_plot = cv2.resize(
            image_from_plot, dsize=(output_image_width, output_image_height),
            interpolation=cv2.INTER_CUBIC)
    return image_from_plot

def progress(value, max=100):
    return HTML("""
          <progress
              value='{value}'
              max='{max}',
              style='width: 100%'
          >
              {value}
          </progress>
    """.format(value=value, max=max))

module = hub.load("https://tfhub.dev/google/movenet/singlepose/lightning/4")
input_size = 192

def movenet(input_image):
    """Runs detection on an input image.

    Args:
      input_image: A [1, height, width, 3] tensor represents the input image
        pixels. Note that the height/width should already be resized and match the
        expected input resolution of the model before passing into this function.

    Returns:
      A [1, 1, 17, 3] float numpy array representing the predicted keypoint
      coordinates and scores.
    """
    model = module.signatures['serving_default']

    # SavedModel format expects tensor type of int32.
    input_image = tf.cast(input_image, dtype=tf.int32)
    # Run model inference.
    outputs = model(input_image)
    # Output is a [1, 1, 17, 3] tensor.
    keypoints_with_scores = outputs['output_0'].numpy()
    return keypoints_with_scores

image_path = 'poses/pose1.jpg'
image = tf.io.read_file(image_path)
image = tf.image.decode_jpeg(image)

# Resize and pad the image to keep the aspect ratio and fit the expected size.
input_image = tf.expand_dims(image, axis=0)
input_image = tf.image.resize_with_pad(input_image, input_size, input_size)

# Run model inference.
keypoints_with_scores = movenet(input_image)

# Visualize the predictions with image.
display_image = tf.expand_dims(image, axis=0)
display_image = tf.cast(tf.image.resize_with_pad(display_image, 1280, 1280), dtype=tf.int32)
output_overlay = draw_prediction_on_image(np.squeeze(display_image.numpy(), axis=0), keypoints_with_scores)

plt.figure(figsize=(5, 5))
plt.imshow(output_overlay)
_ = plt.axis('off')

imageio.imwrite('poses/pose1-marked.png',output_overlay)
print("fin.")
プログラムを実行すると、pose1-marked.pngという名前のアンカー付きの画像が出力されます。
./venv/bin/python3 find-poses.py
実行にはメモリ4GのRaspberryPiで50秒弱くらいかかります。次回はmovenet関数の実行のみでどのくらいかかるかを計測してみたいところです。